
Applying the growth share matrix (BCG Matrix)
Applying the Growth share matrix (BCG Matrix) helps businesses manage product portfolios. It aids in strategic resource allocation based on market growth and share.

The Growth share matrix (BCG Matrix), developed by the Boston Consulting Group, remains a foundational tool in strategic planning for many organizations. From my years consulting with both large corporations and startups in the US and abroad, its simple visual framework often provides a crucial starting point for discussions about product or service portfolio management. It isn’t a silver bullet, but it offers a structured lens through which to evaluate business units or products based on their market growth rate and relative market share.
Overview
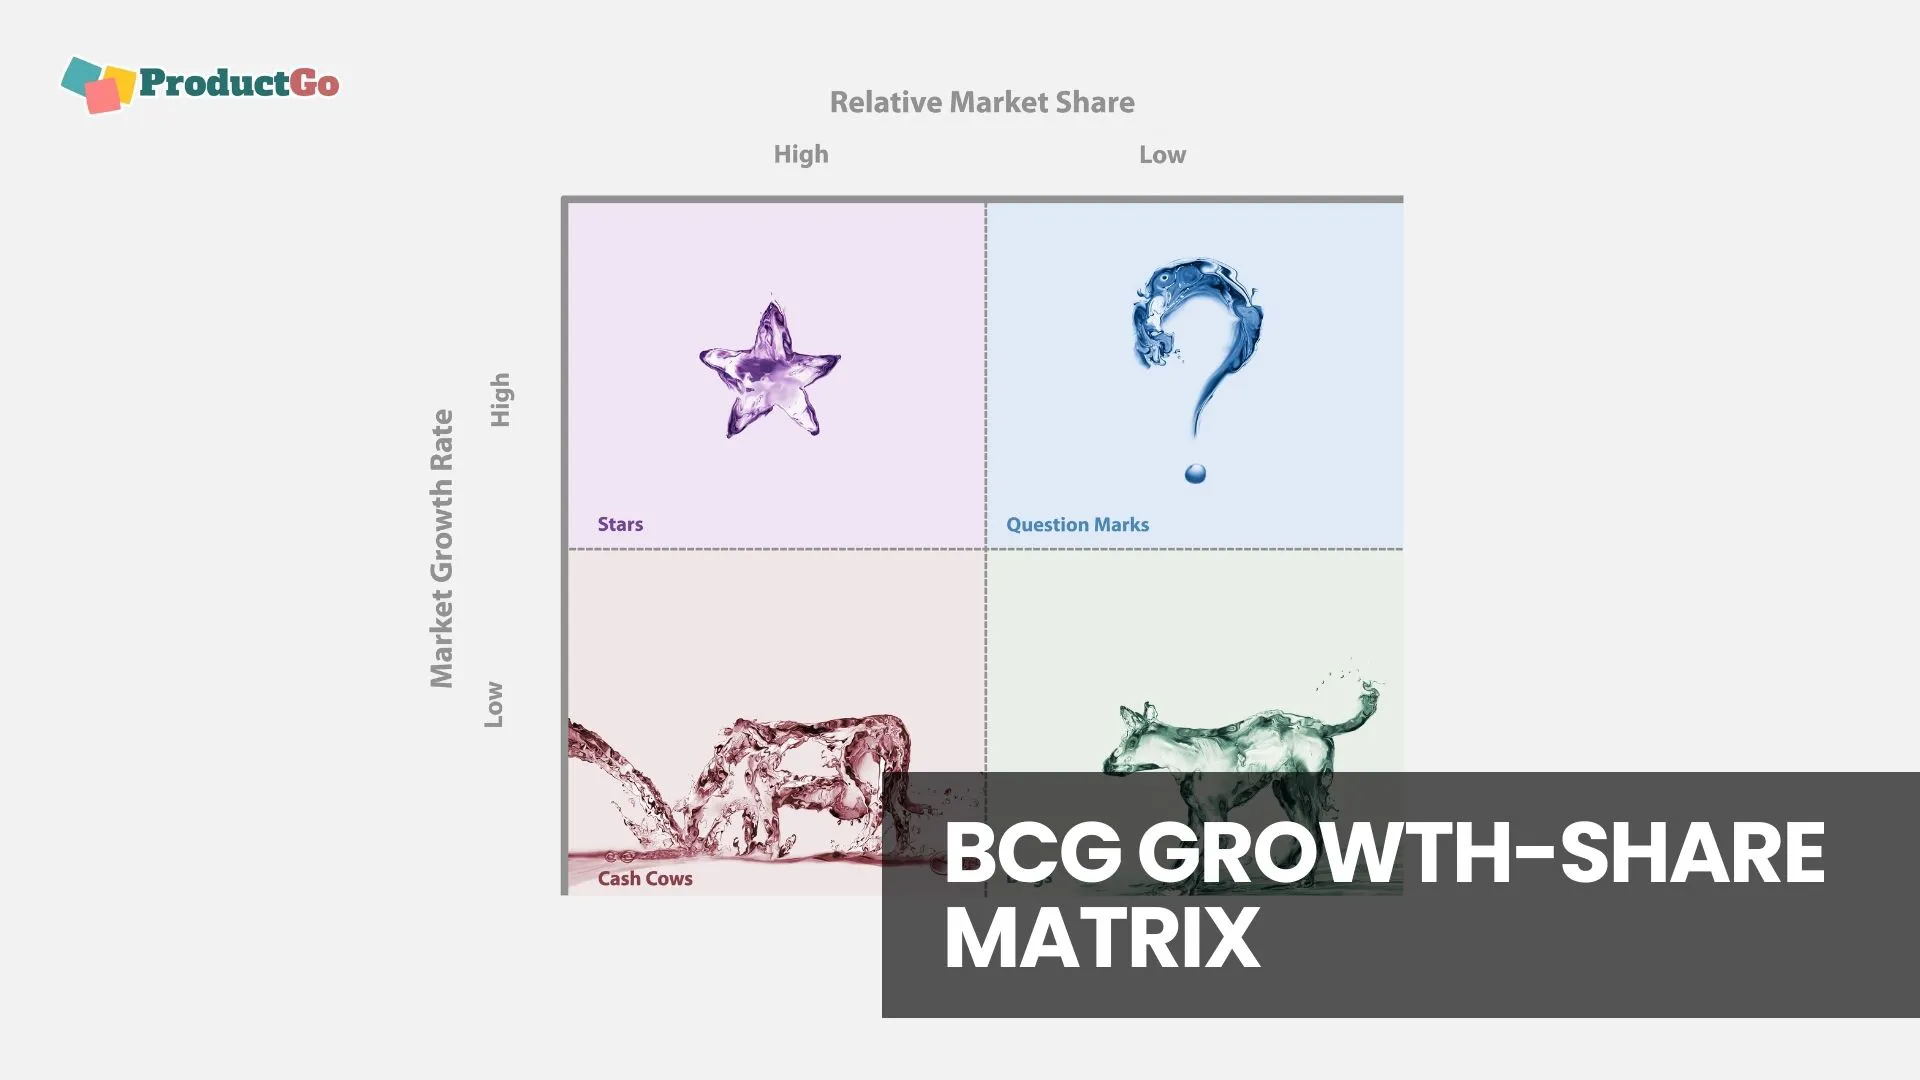
- The Growth share matrix (BCG Matrix) categorizes business units or products into four quadrants: Stars, Cash Cows, Question Marks, and Dogs.
- “Stars” are high-growth, high-market-share products requiring significant investment to maintain their leadership.
- “Cash Cows” are low-growth, high-market-share products that generate more cash than they consume, providing stability and funding for other ventures.
- “Question Marks” are high-growth, low-market-share products with uncertain futures, demanding careful consideration for investment or divestment.
- “Dogs” are low-growth, low-market-share products that often generate low profits or losses and may be candidates for divestment.
- Applying the matrix helps companies strategically allocate resources, prioritize investments, and make informed decisions about their product portfolio’s future.
- Real-world application involves careful data collection, avoiding common pitfalls like oversimplification, and integrating it with broader strategic insights.
Understanding the Quadrants of the Growth Share Matrix (BCG Matrix)
Working with various leadership teams, I’ve seen how quickly the four quadrants of the Growth share matrix (BCG Matrix) become part of the strategic lexicon. Each quadrant signifies a different strategic position for a product or business unit. “Stars” represent products with high market share in rapidly growing markets. They demand substantial investment to fuel their growth and fend off competitors, but they also hold significant future potential. Think of a new tech product that quickly gains traction in an emerging sector; it needs continuous capital for expansion and innovation.
“Cash Cows” are products with a high market share in mature, slow-growth markets. These units typically generate more cash than they consume, acting as the financial backbone of the company. A well-established, widely adopted software solution in a stable industry is a classic example. The cash generated by these cows can then be re-invested into “Stars” or “Question Marks.”
“Question Marks,” sometimes called “Problem Children,” are low-market-share products in high-growth markets. Their future is uncertain. They have the potential to become Stars if invested in wisely, or they could become Dogs if investments fail to capture market share. This quadrant requires careful analysis and often significant, risky investment. Finally, “Dogs” are products with low market share in slow-growth markets. They often generate minimal profits or even losses. The typical strategy here involves divestment, liquidation, or careful management to minimize losses.
Strategic Implications from the Growth Share Matrix (BCG Matrix)
Applying the Growth share matrix (BCG Matrix) extends beyond simple categorization. The real value lies in its power to provoke strategic dialogue and inform resource allocation. For a US-based consumer goods giant, identifying a new beverage line as a “Question Mark” might lead to a dedicated marketing push and increased R&D to boost its market share. Conversely, a mature breakfast cereal brand, a clear “Cash Cow,” would require less investment, allowing its generated profits to fund other high-potential ventures.
Decisions often involve balancing the portfolio. An ideal portfolio would feature a few “Cash Cows” to provide stability, some “Stars” for future growth, and a select number of “Question Marks” to bet on for tomorrow. A company with too many “Dogs” faces sustainability challenges, while one with too many “Question Marks” might be taking on excessive risk without adequate cash flow. This framework forces managers to think about the life cycle of their products and the strategic flow of capital across their business units. It prompts questions like: Which “Question Marks” are worth nurturing into “Stars”? Which “Cash Cows” are nearing their decline and need to be milked efficiently?
Interpreting Portfolio Performance for Decision Making
Understanding where each product or business unit sits within a portfolio is critical for leadership teams. When reviewing an array of offerings, the visual simplicity of the matrix makes it easy to spot imbalances. For instance, a technology company might notice it has many “Question Marks” but few “Cash Cows.” This indicates a portfolio heavy on innovation and future potential, but potentially lacking stable, reliable revenue sources in the present. The decision then shifts to how to best manage this situation: perhaps by divesting less promising “Question Marks” to reduce cash burn, or by aggressively investing in a select few to accelerate their path to becoming “Stars.”
Conversely, a business with many “Cash Cows” and “Dogs” may appear stable, but it could be stagnating. This signals a need for new innovation, shifting resources towards creating new “Question Marks” or acquiring existing “Stars” to rejuvenate the portfolio. Effective interpretation requires more than just plotting points; it means understanding the underlying market dynamics, competitive landscape, and internal capabilities that influence a product’s position. This strategic perspective helps prioritize projects, streamline operations, and ensure that investments align with long-term corporate goals.
Real-World Application Challenges with the Growth Share Matrix (BCG Matrix)
While the Growth share matrix (BCG Matrix) offers a clear framework, its real-world application isn’t without complexities. The primary challenge lies in accurately defining “market growth rate” and “relative market share.” What constitutes “high” growth can vary greatly by industry. A 5% annual growth might be phenomenal in a mature industrial sector but sluggish in a rapidly expanding digital market. Similarly, market share data can be difficult and expensive to obtain accurately, especially for niche products or in highly fragmented markets.
Another common pitfall is oversimplification. The matrix is a snapshot, not a dynamic model. It doesn’t account for competitive responses, technological shifts, or changes in customer preferences that can quickly alter a product’s trajectory. Relying solely on the matrix can lead to short-sighted decisions, such as divesting a “Dog” that holds strategic importance for other products or has untapped potential due to a misread market. I always advise teams to use it as an initial diagnostic tool, complementing it with deeper market research, competitive analysis, and strategic foresight to build a robust and adaptable strategy.


